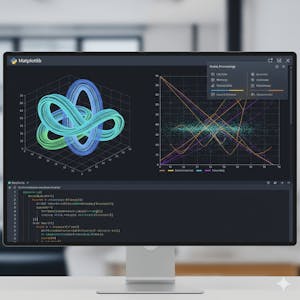
Matplotlib: Python Data Visualization & Wrangling
About this course
This Specialization equips learners with the skills to transform raw data into compelling, publication-ready visualizations using Python’s Matplotlib library. Starting with core plotting concepts, learners progress to advanced customization, 3D charts, and specialized layouts. Practical case studies, such as e-commerce data visualization, ensure hands-on application of concepts to real-world datasets. By the end, learners will be able to design and refine professional-grade visuals that communicate insights effectively for data science, business analytics, and research.
67/100
CourseAsk score
- What the provider tells you
- 31/45
- Who stands behind it
- 20/35
- How complete the listing is
- 16/20
Scores how much the provider publishes and who stands behind it — not how well it is taught.
What you'll learn
- Create basic and advanced plots using Python's Matplotlib library
- Customize visualizations with professional styling and formatting
- Build 3D charts and specialized plot layouts
- Transform raw data into publication-ready visualizations
- Apply visualization techniques to real-world datasets like e-commerce data
Course objectives
- Master core plotting concepts in Matplotlib
- Develop skills in advanced chart customization
- Design professional-grade visualizations for data science and business analytics
- Apply visualization techniques through hands-on case studies
Price shown by Coursera — confirm on their site.
Enroll on CourseraYou'll be redirected to Coursera to complete enrollment.
- Listed & compared by CourseAsk
- English · 0

 Coursera




Compared on these lists
Where this course ranks against the alternatives.